Traditional measure of OCR error
Along with the Edit Distance, the Character Error Rate (CER) is one of the most widely used metrics when measuring OCR quality. It is calculated by comparing the observed string to the ground truth string by counting the number of insertions, deletions, and substitutions needed to turn the predicted text into the ground truth, normalised by the number of characters:
$$\text{CER} = \frac{\text{Substitutions} + \text{Deletions} + \text{Insertions}}{\text{Total characters}}$$
As a rate, CER is simple and easy to understand: lower is better, and no errors return a score of 0.0. As shown in the table below, it can be considered the ideal tool for comparing the sequences of recovered text to the ground truth rather than, say, a simple bag-of-characters (BOC) measure where the essential sequence of letters is lost.
| Text | CER | BOC |
|---|---|---|
| The cat sat on the mat | 0.00 | 0.00 |
| The cit sit on the mit | 0.18 | 0.18 |
| Tam eht no tas tac eht | 0.76 | 0.00 |
When parsing breaks, CER breaks
However, the application of CER has the hidden assumption that the text being analysed is correctly parsed and has a meaningful order; if that is not true, the value of CER can be misleading or even undefined.
The below example shows what CER score would be under different page-parsing scenarios when the OCR engine correctly extracts all characters
In many cases, the biggest problem is Trespass, which, as the example shows, can make extracted text completely unusable. Such trespasses show up in the CER score as huge errors as the sequence is totally wrong. However, the OCR itself may be perfect, and the real issue is a parsing failure which renders the text order irrelevant, making the CER conceptually undefined and its value meaningless.
This makes CER a great metric for measuring local OCR quality on perfectly parsed texts, but a poor metric for the real-world task of measuring global or page-level text extraction quality
Measuring global error
The Character Error Vector (CEV) trades CER’s sequence-awareness for spatial-awareness. Represent a page’s text as a vector of character counts — a bag of characters; however, unlike the simple BOC shown earlier, the ground truth characters’ physical position on the page is taken into account, meaning each predicted region has a ground truth of characters even if the region itself is poor quality. This allows parsing errors and OCR errors to be separated
The CEV defines four vectors:
| Vector | What it is | Error it carries |
|---|---|---|
| $Q$ | ground-truth characters | none |
| $R$ | predicted parsing over GT characters | parsing only |
| $S^*$ | OCR run on the ground-truth regions | OCR only |
| $S$ | OCR run on the predicted regions | combined |
and reads three errors off the differences between them:
$$d_{\text{pars}} = d(R \parallel Q)$$
$$d_{\text{ocr}} = d(S^{*} \parallel Q)$$
$$d_{\text{int}} = d(S \parallel R)$$
with the end-to-end total $d_{\text{total}} = d(S \parallel Q)$. (Because these come from high-dimensional vectors, the parts are not additive, as such $d_{\text{total}} \neq d_{\text{pars}} + d_{\text{ocr}} + d_{\text{int}}$.)
The decomposition, live
The below example shows how two different versions of the CER SpACER (a CER-like magnitude) and JSD (sensitive to the shape of the character distribution) respond to different amounts of parsing and OCR error.
Drag the two sliders — one for page-parsing, one for OCR, and watch how the total and decomposed errors change. d_pars increases when parsing degrades;
d_ocr when transcription does; d_int captures the interaction; d_total is
the combined value.
As you can see, the ability to separate parsing and OCR errors allows you to find the bottleneck in your text extraction or document understanding process and fix it. A high d_ocr with a low d_pars says retrain or replace the OCR engine; the
reverse says your layout model is the bottleneck and better OCR won’t
help.
SpACER: Spatially Aware CER
As shown in the previous example, the CEV is not a single formula but a family of evaluators. The most familiar member is SpACER, the Spatially Aware Character Error Rate, which is a spatial analogue to the CER, returning an overall error rate that is symetric about deletions and insertions at distribution level. It is calculated as below
$$\text{SpACER} = \frac{\hat{E} + D + I}{2C}$$
$$\hat{E} = \lVert g - p \rVert_1 \qquad D = \max(0, |g| - |p|) \qquad I = \max(0, |p| - |g|)$$
where $g$ and $p$ are the ground-truth and predicted character-count vectors and $C = |g|$. It behaves like CER and across the experiments it lands at roughly half the measured CER at the bounding-box level. The other instance provided in the library is the Character Distribution Divergence, as sub-family of the CEV that uses the statistical concept of the divergence. We use the Jensen–Shannon Distance, a proper, bounded metric that reacts strongly when OCR contains rare junk symbols into the text, which is a typical error pattern in certain OCR types.
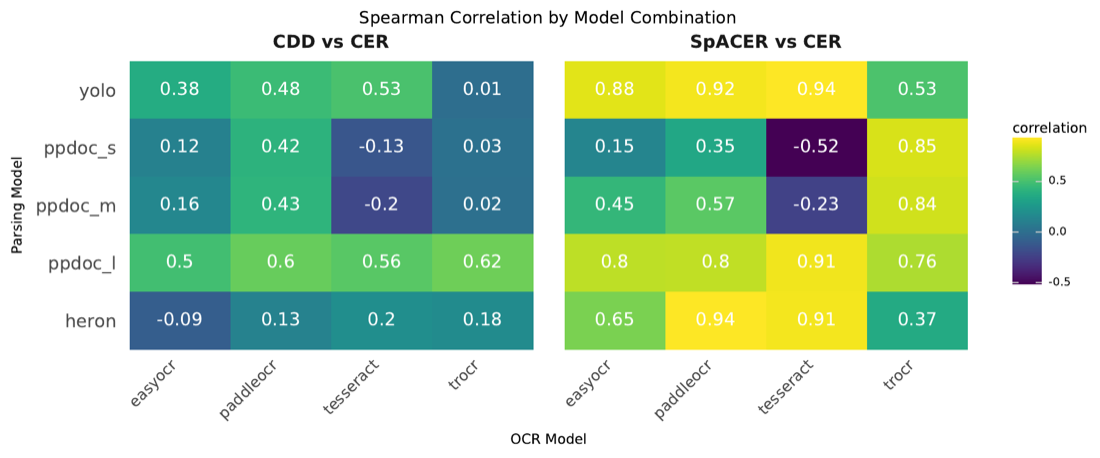
On real, perfectly parsed regions, SpACER is strongly correlated with CER, confirming it measures they measure the same thing:
Case study
We look at a 49-page collection of The Spiritualist a newspaper from the late 1800’s. Archive newspapers have the kind of degraded image and complex layouts that often cause parsing and OCR errors.
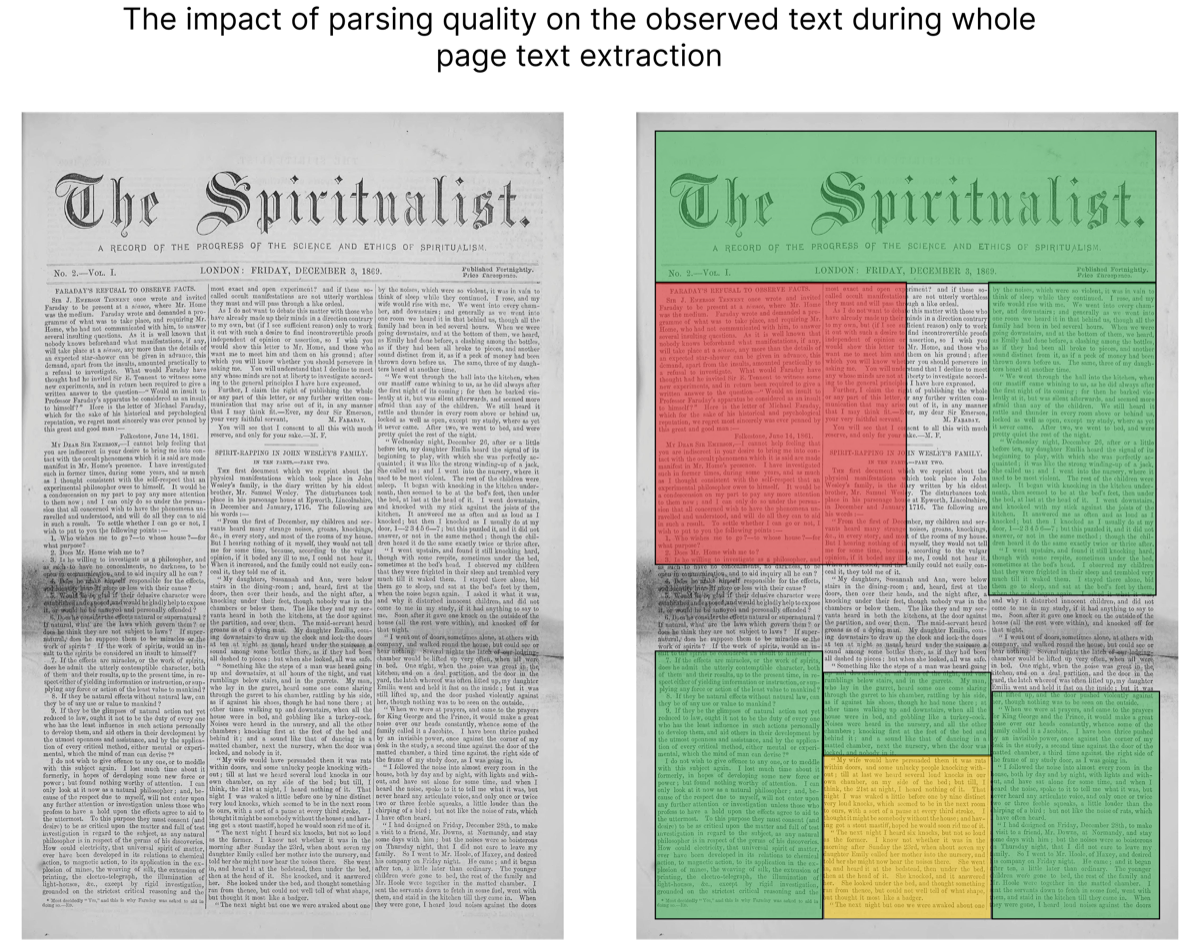
The image below shows some example parsing on a single page. The green boxes are correctly parsed, the yellow boxes are predictions that overlap, and the red box is a prediction that trespasses from one column over half the adjacent column. Unmarked areas of text have no predictions.
We parsed the Spiritualist collection with five different models, then performed OCR on the output with four OCR models; we also ran the pages through three popular end-to-end models that combine parsing and OCR into a single process. The full results can be seen in the paper, but the bar chart below shows a sample of the output of the total SpACER error.
There are two valuable findings. The first is that although the end-to-end models are typically thought of as a better approach, they were all comprehensively outperformed by the combination of simple models. This suggests that for many practical text extraction cases, smaller, more efficient models can be used.
The second interesting finding is that the apparent lowest-error pipeline is, in fact, unusable garbage. PPDoc-S +PPOCR’s low d_total is the classic problem of bag-of-characters shown at the beginning. PPDoc-S simply predicted a large box across the entire page. As a result, the pipeline produces all the right characters in all the wrong places. At first this seems like a critical weakness of the CEV; however, by combining it with analysis of the MOTe error (see previous post), we can easily detect degenerate parsing and reject the results.

That same partnership powers cheap triage: a simple cutoff of $\frac{d_\text{ocr}}{d_\text{total}} \geq 0.5$, combined with a MOTe threshold, predicts whether parsing or OCR is your dominant error source with an F1 of 0.91 — even when you only have region-level boxes, no character positions.
Use it
SpACER and the CDD are available inside the pip-installable mote_error library:
pip install mote_error
The full method, the validation, and the Spiritualist case study are in the paper: arXiv:2604.06160 · code · library.