When using Document Layout Analysis (DLA) models, model performance is usually given as the mean Average Precision across the images in the test dataset. This value is somewhere between 0.0 and 1.0, with 1.0 being a perfect match with the ground truth.
But is a score of 0.9 good? What about 0.8, or 0.7? What if the kind of error being made impacts tasks being performed later in the pipeline? These questions are not something the mAP and its underlying metrics, the F1 and IoU (Intersection over Union), are able to answer. And start pointing to the more fundemental question “What does good mean?”.
This is where the MOTe error can help. MOTe stands for Missing, Overlap, Trespass and excess. It is a decomposable error that separates the different kinds of mistakes found in object detection, allowing practitioners to define “Good” in a way that is meaningful to them.
This guide provides a high-level introduction to MOTe and how it differs from traditional object detection metrics, and is particularly useful for evaluating OCR and Document Understanding models.
Traditional metrics
Pretty much all DLA models use a small tightly related set of metrics that have been inherited from the broader fields of computer vision and object detection:
- IoU (Intersection over Union) — how much a predicted box and a ground-truth box overlap, as a fraction of their combined area.
- F1 — A machine learning staple calculated using Recall (how many of the total were identified) and Precision (The fraction of true positives). In object detection this allows us to calulate how many objects in an image were correctly detected.
- mAP (mean Average Precision) — Typically used for an entire dataset, it is the area under the precision–recall curve, averaged across classes.

These metrics dominate the fields of Object detection because they provide clear numeric values and are easy to calculate, leading them to be adopted by benchmarks and competitions such as PASCAL, VOC, and COCO, which led to the boom in performance and efficiency within object detection models that occurred in the 2010s.
Photos aren’t pages
IoU, F1, and mAP were built for photographs: 2D projections of a 3D world where objects overlap and occlude each other. However, the written page is laid out to fit as much text as possible while still being readable. It’s more similar to a 2D tessellation: text tiles the surface with no gaps, and where overlaps are impossible.
This is where the MOTe error differs: instead of IoU, which uses only spatial information, it uses a concept called the Structural Semantic Unit (SSU), which combines spatial and Semantic information. This means that two separate boxes containing text may be part of the same SSU because they can logically be combined, for example, two adjacent paragraphs of text.
The granularity trap and the ability to represent reality
A major problem with the current crop of IoU-based approaches is the need to set an IoU threshold. If the IoU does not reach the threshold, the score is effectively 0, whilst if it is above it is 1. This binary way of thinking about prediction can lead to some pretty strange situations, as shown in the example below.
The example shows two sets of boxes outlining a page of text: on the left is the ground truth broken across 3 boxes, which make up a single SSU, and on the right is the model predictions where the number of predicted boxes can be varied. As can be seen, the union/sum of the outlines of the predictions covers exactly the same area as the union/sum of the ground truth.
In all cases the parse is perfect only the granularity changes. Flip between coarser, aligned, and finer, to see what happens.
The example shows that the F1 goes to zero, its worst possible value, when the predictions are either 1 or 9 boxes relative to the ground truth’s 3. This is because the IoU is less than 0.5. In contrast, the MOTe error stays at zero, its best possible value, throughout: nothing is missing, nothing overlaps and nothing trespasses. This is because F1 pairs boxes one-to-one by overlap, so it scores well only when the model’s granularity matches (or is close to) the ground truth label granularity.
When the granularity diverges from the ground truth, the F1 can collapse even if the model has performed well. This is called Pragmatic Failure as the evaluation metric fails to understand the model data relationship. The MOTe error succeeds because it has more Pragmatic Competance or ability to interpret the results.
Beyond high and low scores: analysing decomposed scores
Beyond its use of the SSU, which gives MOTe its granularity robustness, the MOTe error can be decomposed into 4 components, each measured against the area of the ground-truth content:
- Missing — how much of the content no prediction covers at all.
- Overlap — content covered by more than one box.
- Trespass — a box bleeding into a different semantic unit, merging unrelated text.
- excess — predicted area landing in the margins, outside any content. This is a support metric for additional context, hence the lower-case e: it is reported alongside MOTe but is not part of the sum.
The total MOTe error is simply:
$$\text{MOTe} = \mathcal{M} + \mathcal{O} + \mathcal{T}$$
Lower is better. A perfect parse is 0.0 and occurs when Missing, Overlap and Trespass are all 0.0. A page with no predictions at all scores 1.0, and really poor parsing can even push MOTe above 1, worse than predicting nothing!
Using the example below, click off/on the predictions and drag them about to see how this affects the MOTe error and its decomposition.
In the example, there are three SSU ground-truth blocks shown by the blocks of grey lines. Text that no prediction covers is shaded grey as Missing. Predictions are assigned to an SSU based on the total fraction of the predicted box. As you move a prediction across the page, you can see that the Covered and Trespass areas suddenly flip, this is when the assigned SSU has changed.
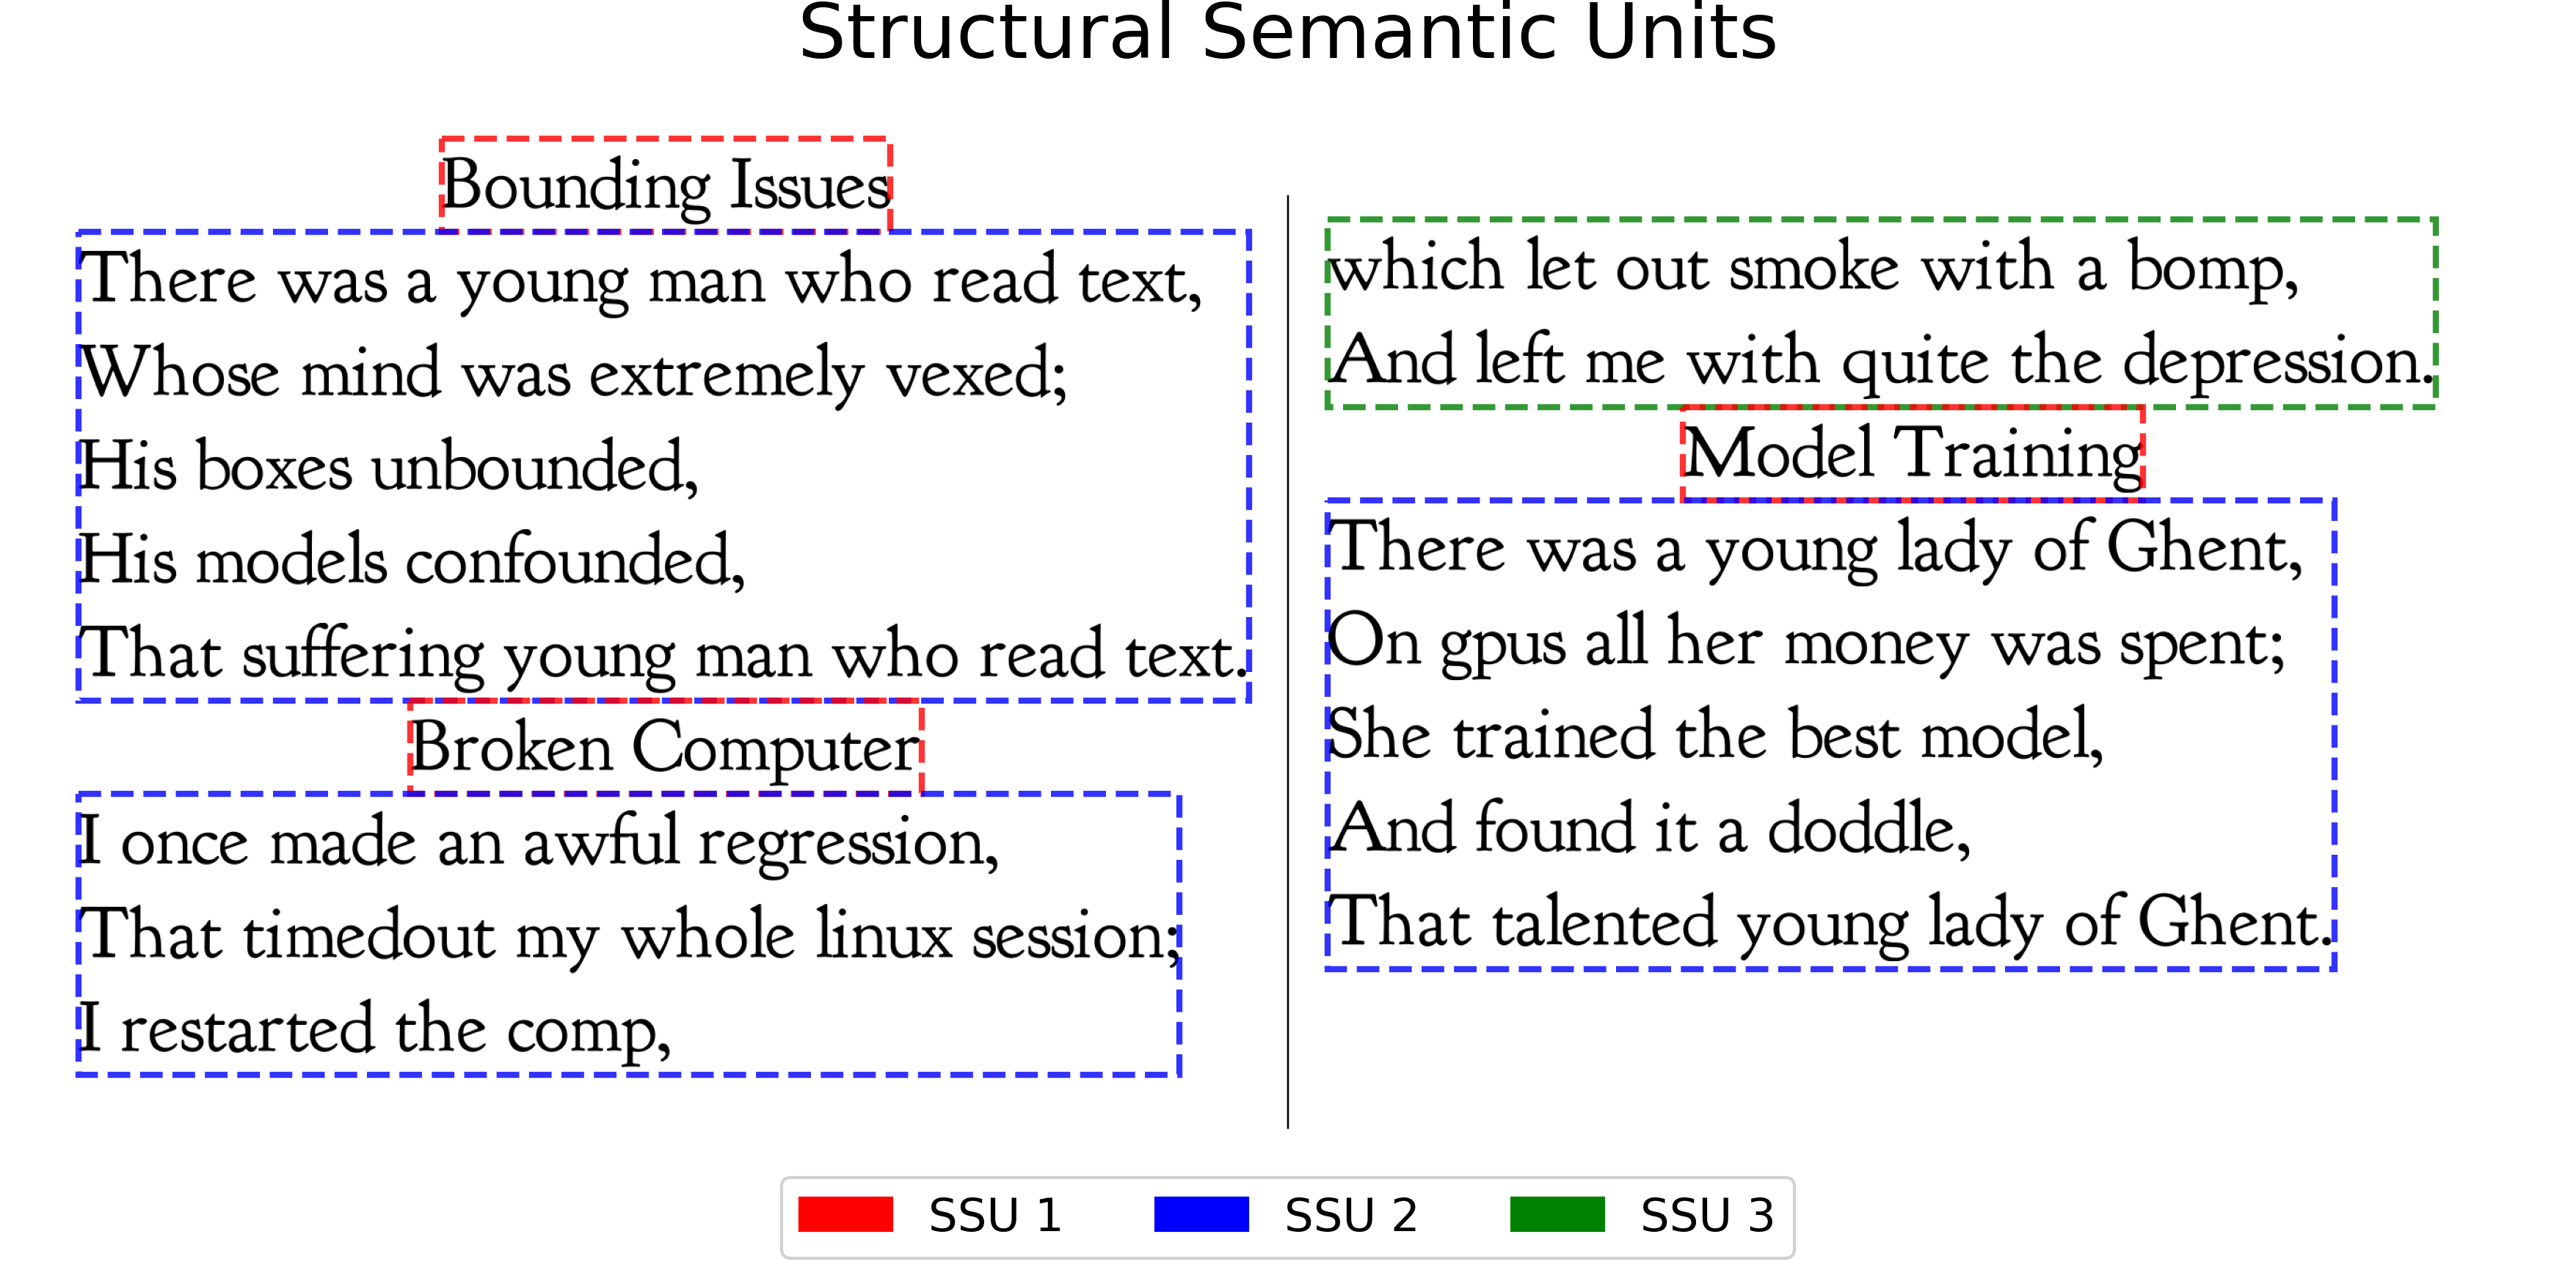
The below image shows some text with the SSU of the limericks highlighted. The 1st and 3rd limericks both have two SSU the title and the body text, whilst the second SSU is broken across two columns and resulting in three SSU.
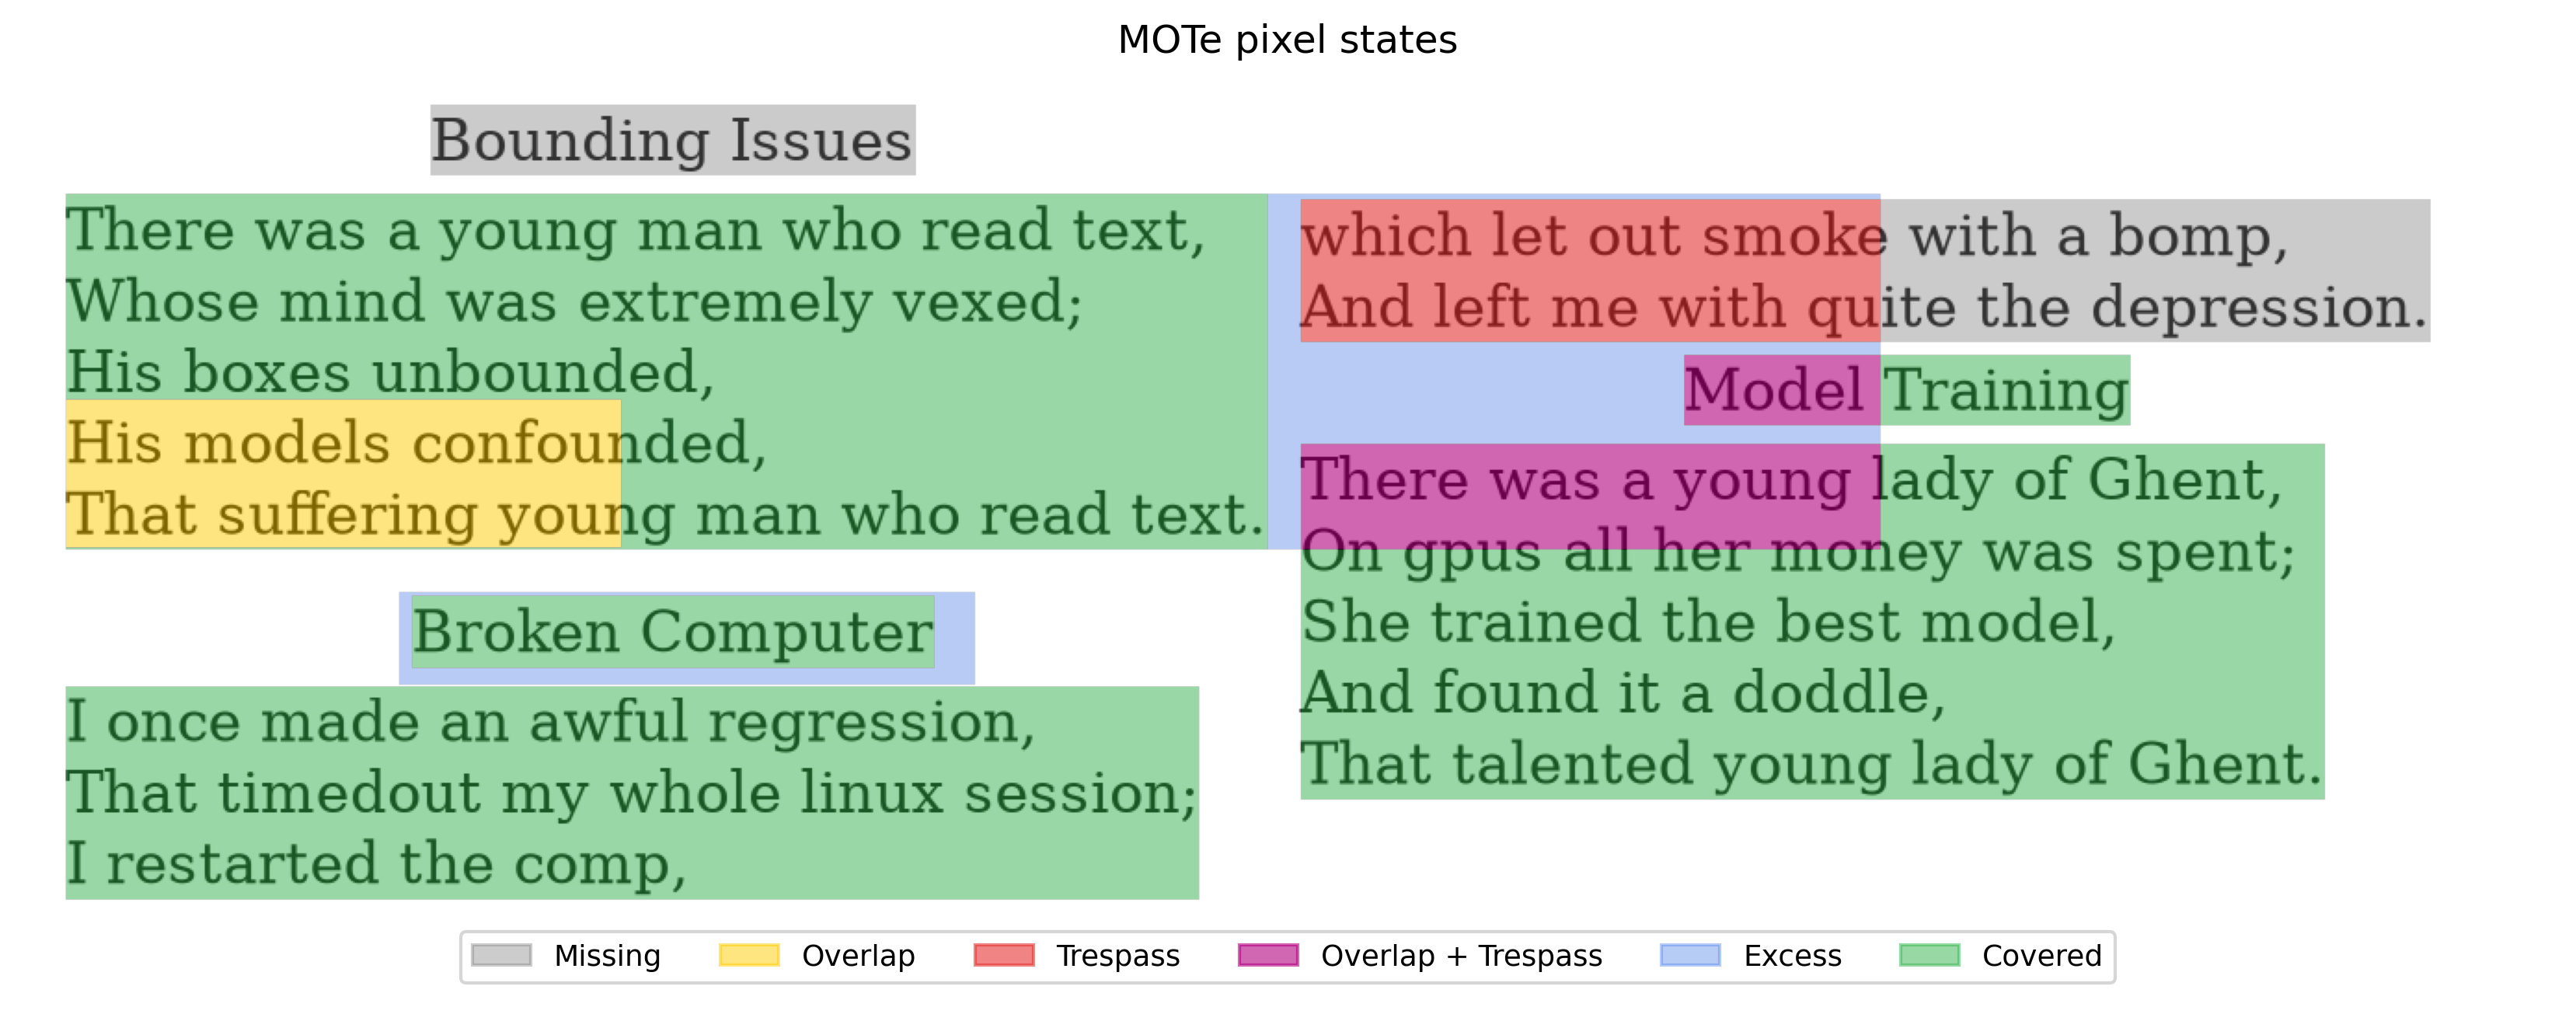
The image below shows how the MOTe error would be built up for a set of predictions over the three limericks.
Real models, real failures
In the image below and the following bar chart, we compare three different real DLA models and their ability to parse a real archival newspaper page. It’s clear that there can have very big overall performance differences between models and that the way the models fail can be very different even when overall performance is similar.
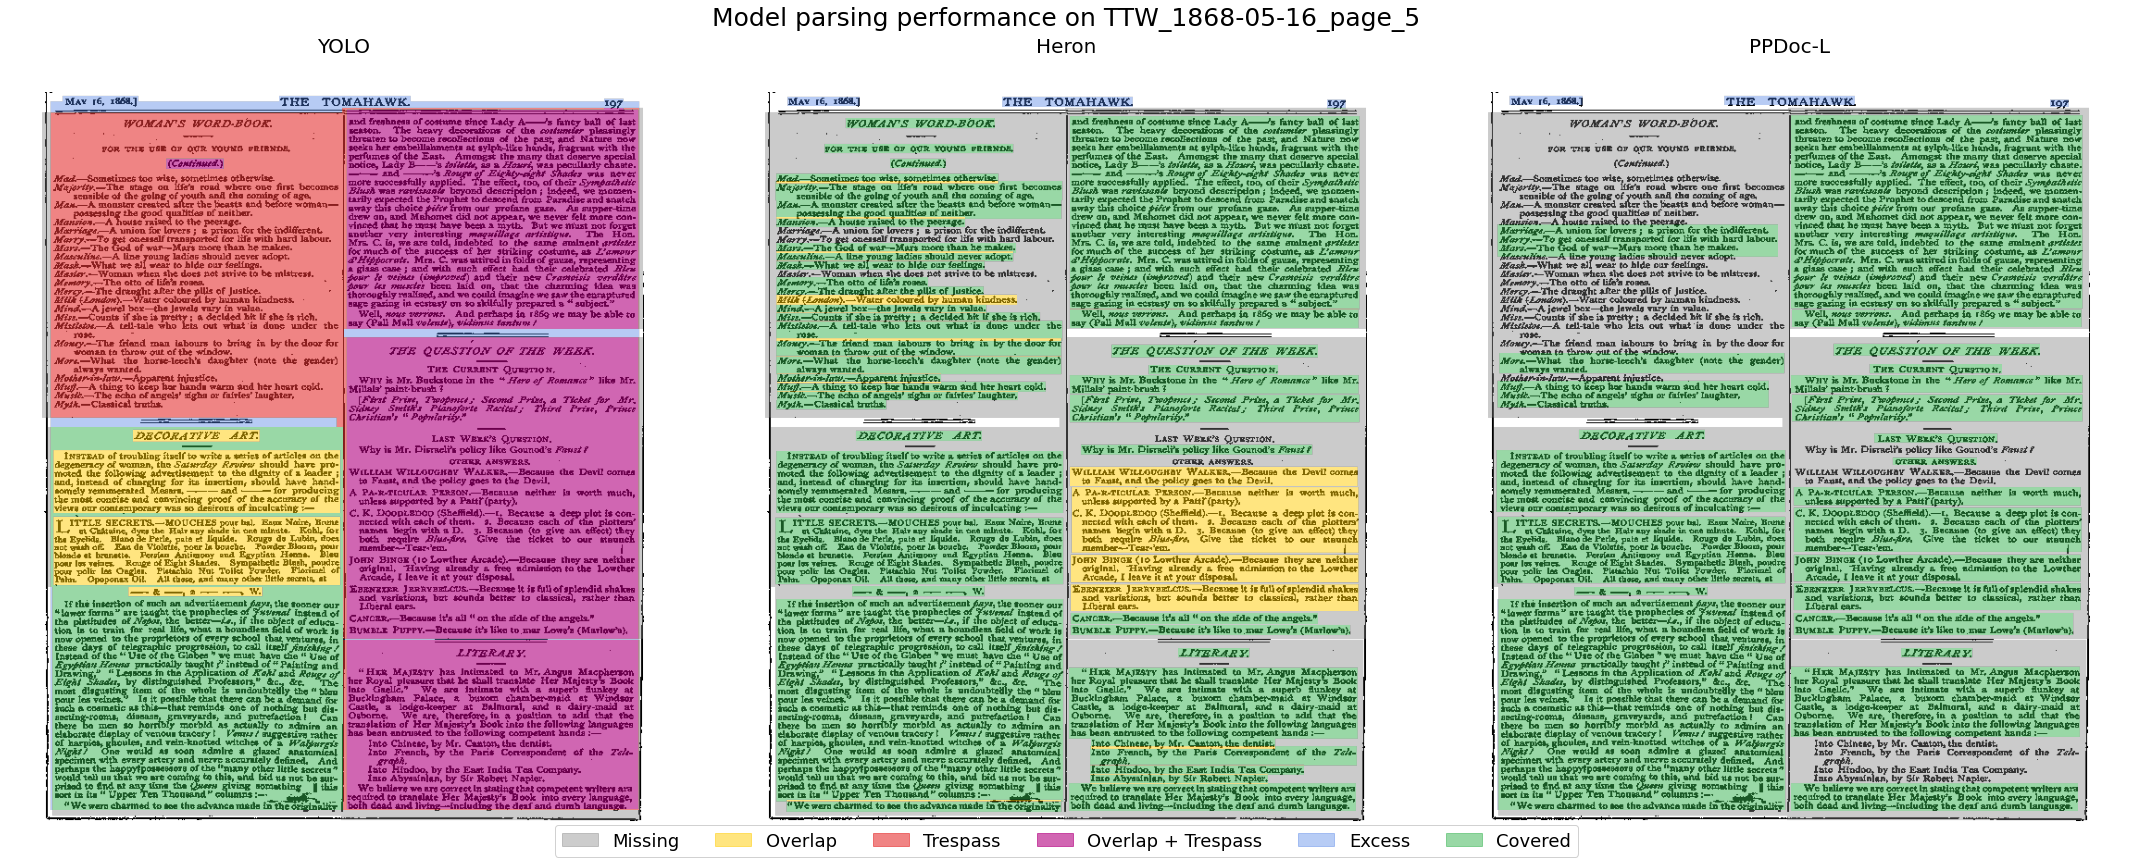
DocLayout-YOLO misses almost nothing (Missing 0.02) but smears boxes across column boundaries (Trespass 0.98, Overlap 0.59), resulting in a MOTe of 1.60, worse than predicting nothing. Heron and PP-DocLayout have no Trespass but miss more of the text, scoring around 0.35. IoU and F1 rate all three as mediocre and don’t identify the differences, making model selection or mitigation strategies difficult.
Use it
The MOTe error is available as part of a pip-installable Python library:
pip install mote_error
The library contains all the tools necessary for a MOTe analysis of a dataset, including visualisations, and can easily be built into any DLA workflow. Although ideally the data is labelled with SSU (An ALTO auto-labeller is included in the library), it is often not necessary to get most of MOTe’s robustness benefits.
The full method is available in the paper: arXiv:2603.12718 · code.